


The Single Cell Omics field has seen a few announcements in October, many seemingly as a reaction to competitors’ announcements in what the social media sites have labelled as “the fight for the $0.01 single-cell frontier”.
Evercode WT v3
Parse Bio, one of the companies selling instrument-free kits for their multi-step cell barcoding methodology, has put out a Technical Note comparing the Evercode Whole Transcriptome v3 product with their fiercest competitor, 10X Genomics TXG 0.00%↑ .
In this comparison, Parse claims that the head-to-head sensitivity comparison shows a superior gene detection with their Evercode WT v3 product, when compared to 10X Genomics GEM-X product. They claim that cell type proportions are equivalently represented and that the evaluation of differentially expressed genes reveals that Evercode detects twice as many differentially expressed genes as 10X GEM-X.
Differential gene expression (DGE) methods have become a mainstream tool in single-cell transcriptomics over the past decade, marking a significant evolution from bulk RNA sequencing (RNA-seq) approaches, which gained widespread use about two decades ago. Bulk RNA-seq, typically performed with short-read Illumina sequencing, provided (and still does) valuable insights by averaging gene expression across entire tissue samples, but it is limited by the inability to cleanly resolve individual cell types within the population.
With the advent of single-cell RNA sequencing (scRNA-seq), researchers can now analyze gene expression at the resolution of individual cells. This has enabled the identification of distinct cell types within heterogeneous populations and facilitated DGE analysis to detect which genes are differentially expressed across these various cell types within a sample or across different conditions or samples.
This capability has become crucial for a wide range of applications. In basic science, it helps unravel complex biological processes, such as development, immune response, and disease progression, by understanding how gene expression varies between individual cells. In drug discovery, single-cell DGE can identify cellular targets, assess drug effects at a granular level, and uncover new therapeutic avenues by understanding cell-specific responses.
The combination of scRNA-seq with DGE methods has opened new possibilities in biology and medicine, offering a more precise and comprehensive view of gene regulation and cellular diversity.
Parse Bio did the head-to-head comparison by applying their WT v3 methodology side-by-side with the Chromium GEM-X equivalent approach via a Certified Service Provider.

The samples assayed where two embryonic mouse brain samples, sagittally dissected into 2 halves, and flash frozen by a third-party tissue vendor. Half of each brain was shipped to the provider of 10X services for nuclei isolation and library prep. The other halves of each brain were processed by Parse for nuclei isolation, fixation, and library preparation. All sequencing was done by a third-party, data was analysed by equivalent manufacturer’s data analysis pipelines. Parse has a tool called Trailmaker for downstream analysis and visualization which can integrate both data types.
he results of Median Genes per Cell shown here favour Parse in the comparison to GEM-X.


The UMAP plot comparison is practically indistinguishable.
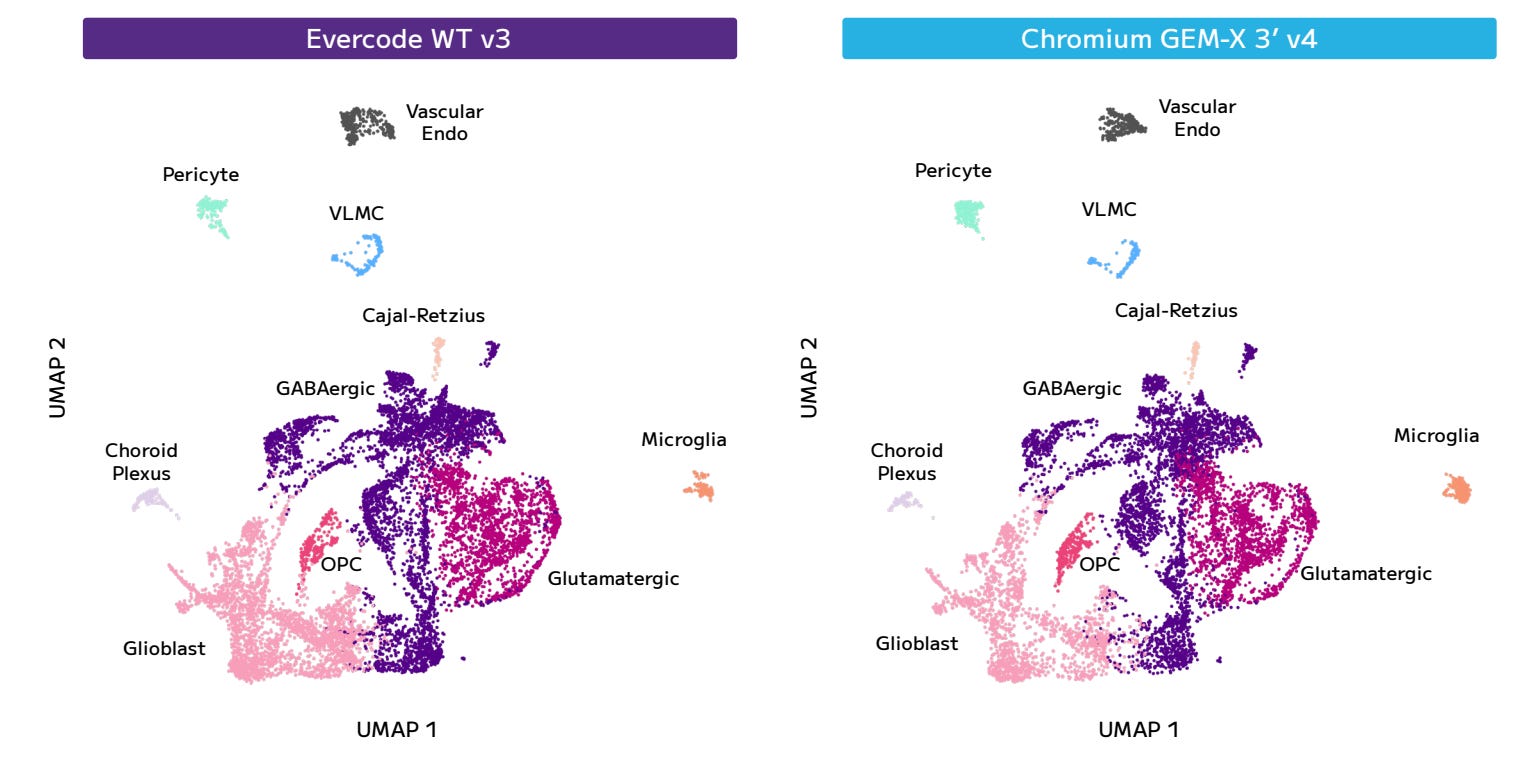
And we see the same for the different cell type proportions.
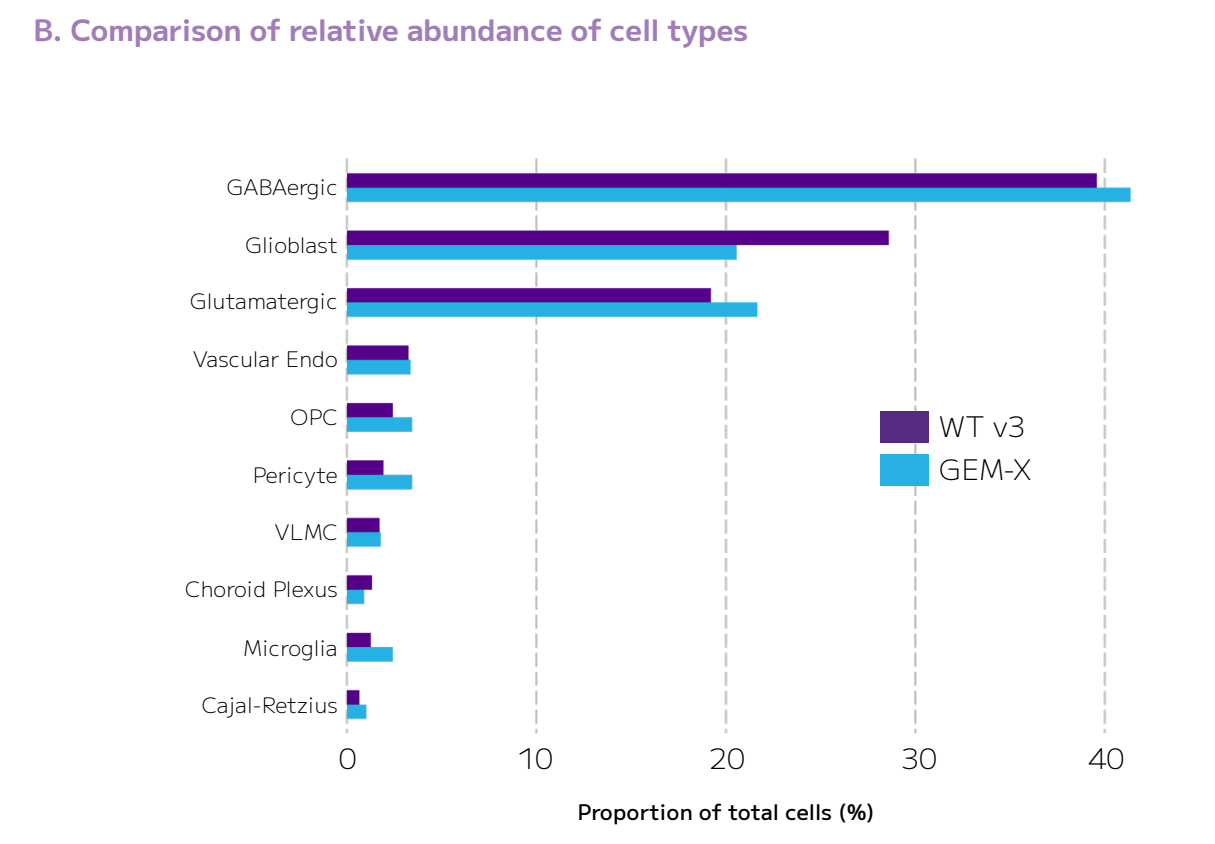
That being said, Parse Bio is not emphasizing the fact that they capture a larger proportion of Glioblast cells, or in comparison, they capture fewer of the cells of the other cell types.
Could this be due to the relative size of Glioblast cells compared to the other types?
Here's a comparison:
Glioblast cells (precursors to glial cells): Glioblasts are intermediate-sized cells. They differentiate into various types of glial cells, such as astrocytes and oligodendrocytes. These cells tend to be smaller than large neurons but larger than some microglia.
GABAergic cells (GABA-releasing inhibitory neurons): These are neurons, and neurons are generally larger than glial cells. GABAergic neurons, depending on their subtype, can vary in size but are generally larger than glioblasts because they are fully differentiated neurons.
Glutamatergic cells (glutamate-releasing excitatory neurons): Like GABAergic neurons, these cells are typically larger than glioblasts. Neurons have large cell bodies to accommodate their complex functions, including signal transmission and synaptic integration.
Vascular Endothelial cells: These cells line blood vessels and are generally comparable to or smaller than glioblasts. They are thin and elongated to form a barrier in blood vessels but are less bulky than neurons.
Choroid Plexus cells: These epithelial cells, involved in producing cerebrospinal fluid (CSF), are larger and bulkier compared to glioblasts, as they perform secretory functions and have a large cytoplasmic area.
Microglia cells: Microglia are the smallest of the glial cells and are smaller than glioblasts. They are the brain’s immune cells and are highly motile, patrolling the brain for damage or infection.
Cajal-Retzius cells: These are specialized neurons found in the developing brain and play a role in brain development, particularly in cortical layer formation. They are larger than glioblasts, though not as large as some mature neurons.
In summary, neuronal cells (GABAergic, Glutamatergic, Cajal-Retzius) tend to be larger than glioblasts, while microglia are smaller, and vascular endothelial and choroid plexus cells are more variable but often comparable or larger, depending on their specific roles. In this comparison, Parse Bio tends to do better with mid-sized cells, and under-represents large cells and smaller cells. It’s difficult to say how much does this translate in general, but it is an significant result in this comparison.
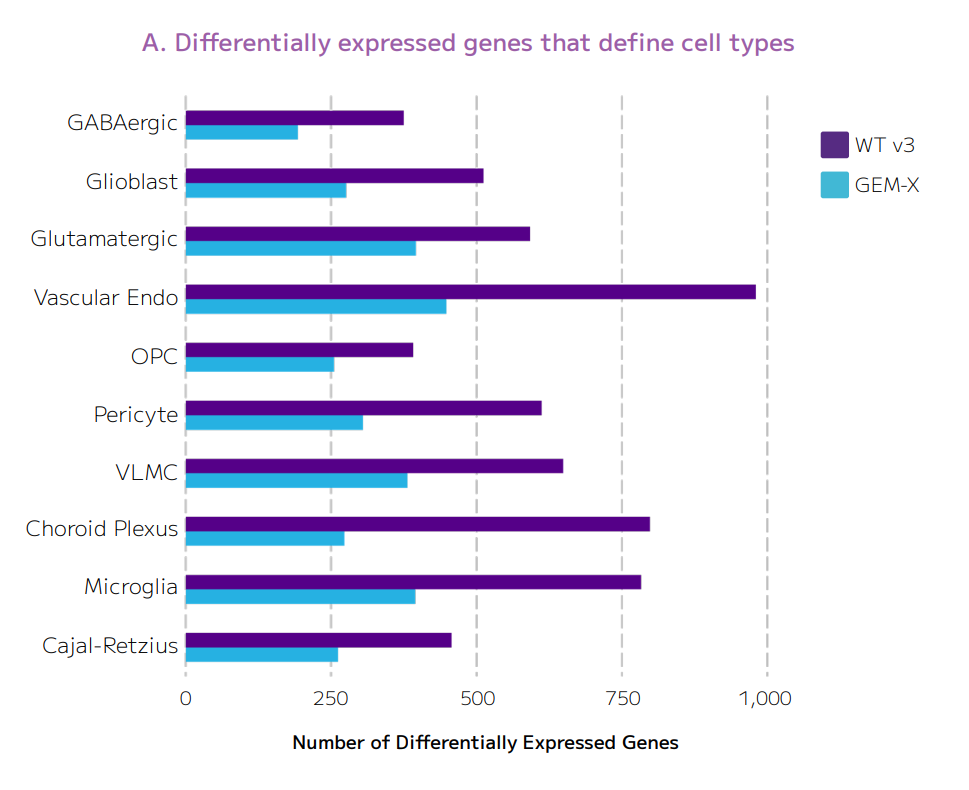
When it comes to Differentially Expressed Genes, we see that WT v3 sees about double than GEM-X for almost all cell types, with Glutamatergic and OPC being the least different, and Choroid Plexus possibly the largest difference.
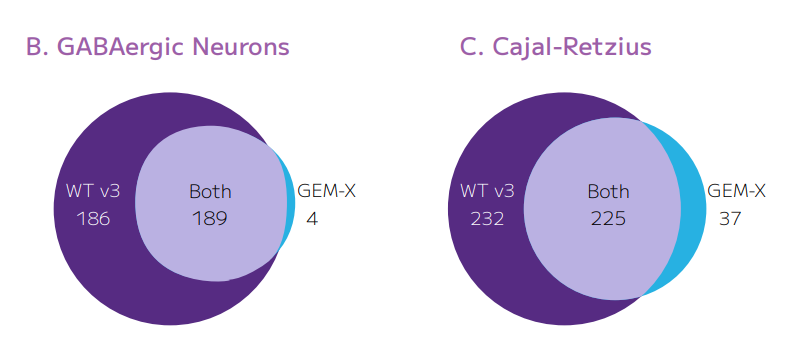
In terms of consistency, both methods identify a large agreeing overlapping fraction, but Parse identifies more outside of the overlapping fraction.
Parse Bio claims that their sensitivity is 26% higher than GEM-X, at 50,000 reads/cell depth of sequencing.
10X Genomics GEM-X Flex method and on-chip multiplexing
10X Genomics hasn’t kept quiet and instead, they’ve put out documents that emphasize the high-throughput nature of their technology, now able to do millions of cells at a price of less than $0.01 per cell.
This is part of their product evolution from their Next-GEM kits to GEM-X kits, with many examples in the table below:

10x Genomics has announced two new offerings, emphasizing cost-effectiveness for researchers using single-cell technologies. According to the company, these solutions are designed to make high-performance single-cell analysis more affordable and accessible for various research scales.
First, 10x Genomics introduces GEM-X Flex Gene Expression, which they claim combines the advancements of GEM-X technology with the flexibility of the Flex Gene Expression assay. This solution is targeted at large-scale studies and is suitable for use with fresh, frozen, or fixed samples, including FFPE. The company states that researchers can profile up to 2.56 million cells per run, with starting inputs lower than before, and at a cost of less than $0.01 USD per cell.
The second offering, according to 10x Genomics, is on-chip multiplexing for 3’ & 5’ gene expression, which simplifies multiplexing workflows. The company highlights that this innovation allows researchers to multiplex samples with lower cell inputs, particularly beneficial for limited samples like stem or flow-sorted cells, without the need for additional steps. They also claim this can be done at a price of less than $565 USD per sample.
Both solutions aim to support researchers at various scales, from smaller projects to large, high-throughput studies, while maintaining lower price points.
STAMP method for Spatial Omics
Luciano Martelotto went on social media to explain more about a method him and colleagues recently published called STAMP.

Given this new method, one can take the output of single-cell sample preparation and load it on one of the Spatial Profiling instruments like the 10X Genomics Xenium, and obtain a multi-omics readout, e.g. STAMP-X-CP or PCF (Multimodal RNA+Protein), or individually obtain the STAMP-X RNA readout. This doesn’t require any libraries going into an Illumina ILMN 0.00%↑ instrument for NGS sequencing, which is something that should worry Illumina as a potential loss of revenue if this methodology picks up in adoption.

STAMP uses an imaging-based approach to perform high-throughput RNA and protein profiling by stamping cells onto slides compatible with CosMx and Xenium platforms, allowing multimodal profiling in a single run. STAMP supports single-modal (RNA/protein) and multimodal (RNA + protein) profiling, enhancing experimental flexibility and scalability. This versatility is essential for large-scale atlases and mixed-sample experiments. STAMP scales easily: from less than 100 to millions of cells. It overcomes limitations in droplet-based systems, where throughput is often constrained by sequencing costs.
Here’s a cost comparison between GEM-X and STAMP-X for RNA profiling:
GEM-X RNA (20k cells): $0.0764/cell
1M cells = $76,400 (cost/cell = $0.0764)
2M cells = $152.800 (cost/cell = $0.0764)
3M cells = $229,200 (cost/cell = $0.0764)
STAMP-X RNA (1M cells): $0.0075/cell
1M cells = $7,500 (cost/cell = $0.0075)
2M cells = $7,500 (cost/cell = $0.00375)
3M cells = $7,500 (cost/cell = $0.0025)
In STAMP cells remain intact after imaging, enabling further downstream applications like histological validation or additional molecular assays, adding value to each sample. In a high-throughput immuno-phenotyping experiment, STAMP profiled 1.7M PBMCs, capturing a median of 83 transcripts and 49 genes per cell. This resulted in high-resolution immune profiling.
Whole cells vs. nuclei: STAMP's ability to profile both whole cells and nuclei is crucial for samples with low RNA content (e.g., archived tissues), increasing the platform’s applicability.
These numbers for GEM-X contrast with the GEM-X Flex and on-chip multiplexing numbers that 10X Genomics has published, but still, it’s interesting to see the two different approaches.
Strategic positioning
Who are the winners and losers from these announcements?